
The median-sales price for existing homes hit an all-time high for the month in June, as the pace of sales declined, the National Association of REALTORS® said.
Courtesy of the National Association of REALTORS®.
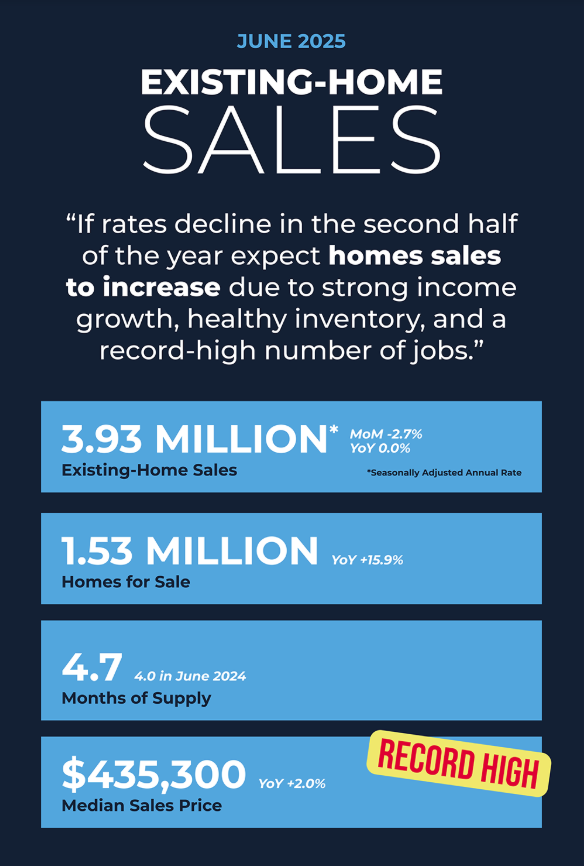
The median existing-home sales price for all housing types rose 2% year over year to $435,300, the highest ever recorded for June. The pace of existing-home sales slid 2.7% month over month to 3.93 million, the same rate as June 2024.
“Multiple years of undersupply are driving the record-high home price,” NAR Chief Economist Lawrence Yun said. “Home construction continues to lag population growth. This is holding back first-time home buyers from entering the market. More supply is needed to increase the share of first-time homebuyers in the coming years even though some markets appear to have a temporary oversupply at the moment.”
The 30-year, fixed-rate mortgage averaged 6.75% as of July 17, according to Freddie Mac. That’s up from 6.72% a week before and 6.77% a year earlier.
By property type, single-family home sales slid 3% month over month and rose 0.6% year over year to a seasonally adjusted annual rate of 3.57 million. The median existing single-family home price was $441,500, up 2% on a year-over-year basis.
Existing-condominium and co-op sales remained at May’s annual rate of 360,000 units, representing a 5.3% decline from June 2024. The median existing-condo price was $374,500, up 0.8% from June 2024.
Homes typically remained on the market for 27 days in June, the same as in May and up from 22 days in June 2024.
Inventory rose to 4.7 months from 4.6 months in May and 4 months in June 2024.
“Today’s existing-home sales data further reinforces the market’s ongoing shift toward a more balanced environment in many areas, and sellers will need to adjust expectations accordingly,” Coldwell Banker Affiliates President Jason Waugh said. “Unlike in recent years — when listings often attracted immediate interest and offers within minutes — today’s environment might require a more measured approach, depending on the dynamics of the local market.”
Regionally, month-over-month sales declined in the Northeast, Midwest and South and rose in the West; year-over-year, sales dipped in the Northeast and West and rose in the Midwest and South.