
By the Numbers

Geographically, the only region to post a monthly increase in pending sales was the Northeast, where they rose 2.1%, according to NAR’s Pending Home Sales Index.
Nationally, the pace of home-price appreciation declined to its slowest pace in almost two years, according to the S&P CoreLogic Case-Shiller U.S. National Home Price Index.

Painted Tree, a McKinney master-planned community from Oxland Group, was the top-selling MPC in the Metroplex and the No. 17 MPC in the country, with 330 new-home sales from January through June.

Statewide, the median home price decreased 1.4% year over year to $340,000. Amid that increased affordability, closed home sales also increased 1.4% year over year with 95,264 closings.
The inventory of new homes for sale surged year over year, according to the U.S. Census Bureau and the U.S. Department of Housing and Urban Development.
At the same time, the pace of existing-home sales declined from May’s level.
New single-family home construction declined as builders continue to grapple with macroeconomic headwinds.
Purchase applications slowed to their lowest level since May as economic worries dampened activity, the Mortgage Bankers Association said.

GoBankingRates looked at cities with 5,000 or more households and narrowed it down to the 50 cities with the highest average household income.
The Steamboat Group Real Estate analyzed home ages in every state across the country and found that in Texas, 22.5% of all homes were built in the last 15 years.
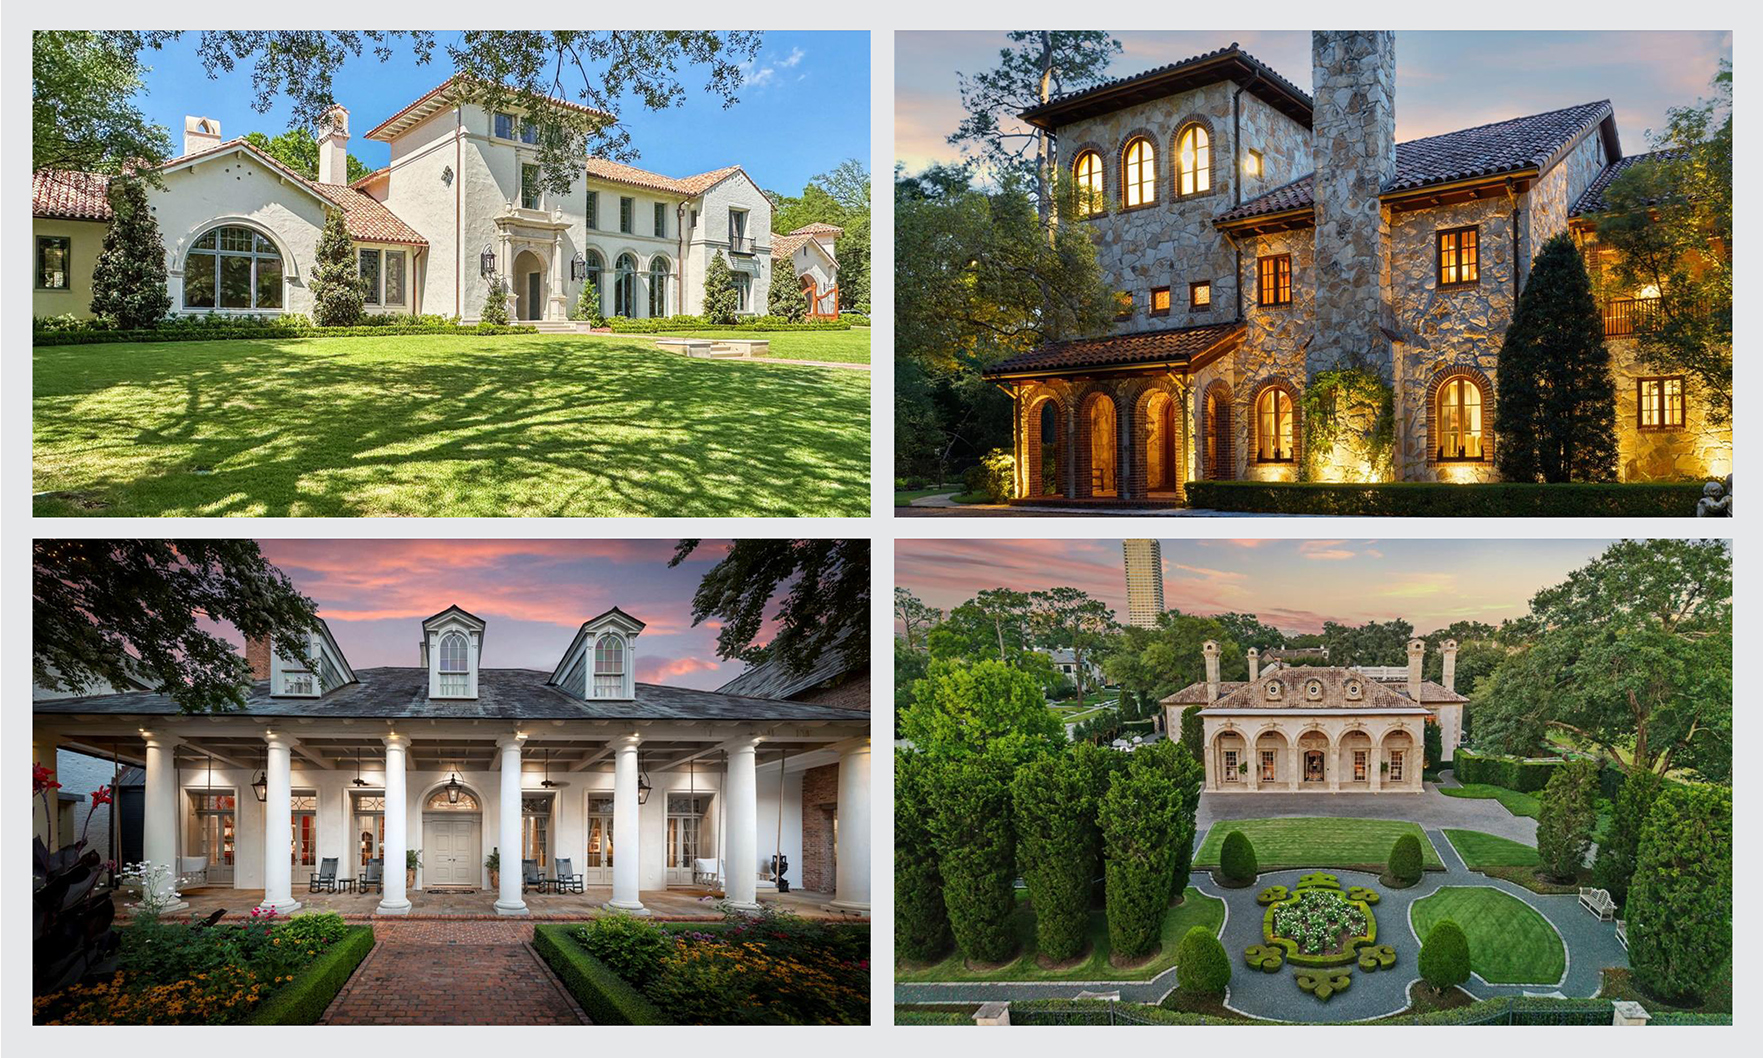
Boutique brokerages are prominently featured on this month’s ranking of the 10 most expensive new listings in the Lone Star State.
May’s 1.8% monthly gain follows a 6.3% drop in April, the National Association of REALTORS® said.
The pace of home-price appreciation slowed to its most modest pace since 2023, according to the S&P CoreLogic Case-Shiller U.S. National Home Price Index.
The median-sales price for an existing home rose 1.3% year over year to $422,800.
Homebuilder sentiment recently reached its third-lowest level since 2012.
The Mortgage Bankers Association said the post-Memorial Day increase came despite economic uncertainty and largely static interest rates.