
Homes in most counties in the Fort Worth area spent more time on the market in October, according to the latest report from the Greater Fort Worth Association of REALTORS®.
However, President Shawn Buck cautioned that widespread trends are not indicative of every individual market.
“Real estate will always be hyper local,” Buck said in a press release. “Fort Worth is a growing region, and the housing stats we are seeing communicate that there is a still a rush to snap up a home when it becomes available. That said, now is the time to buy and sell, with prices, for the most part, holding steady and a decent amount of inventory to fill housing needs.”
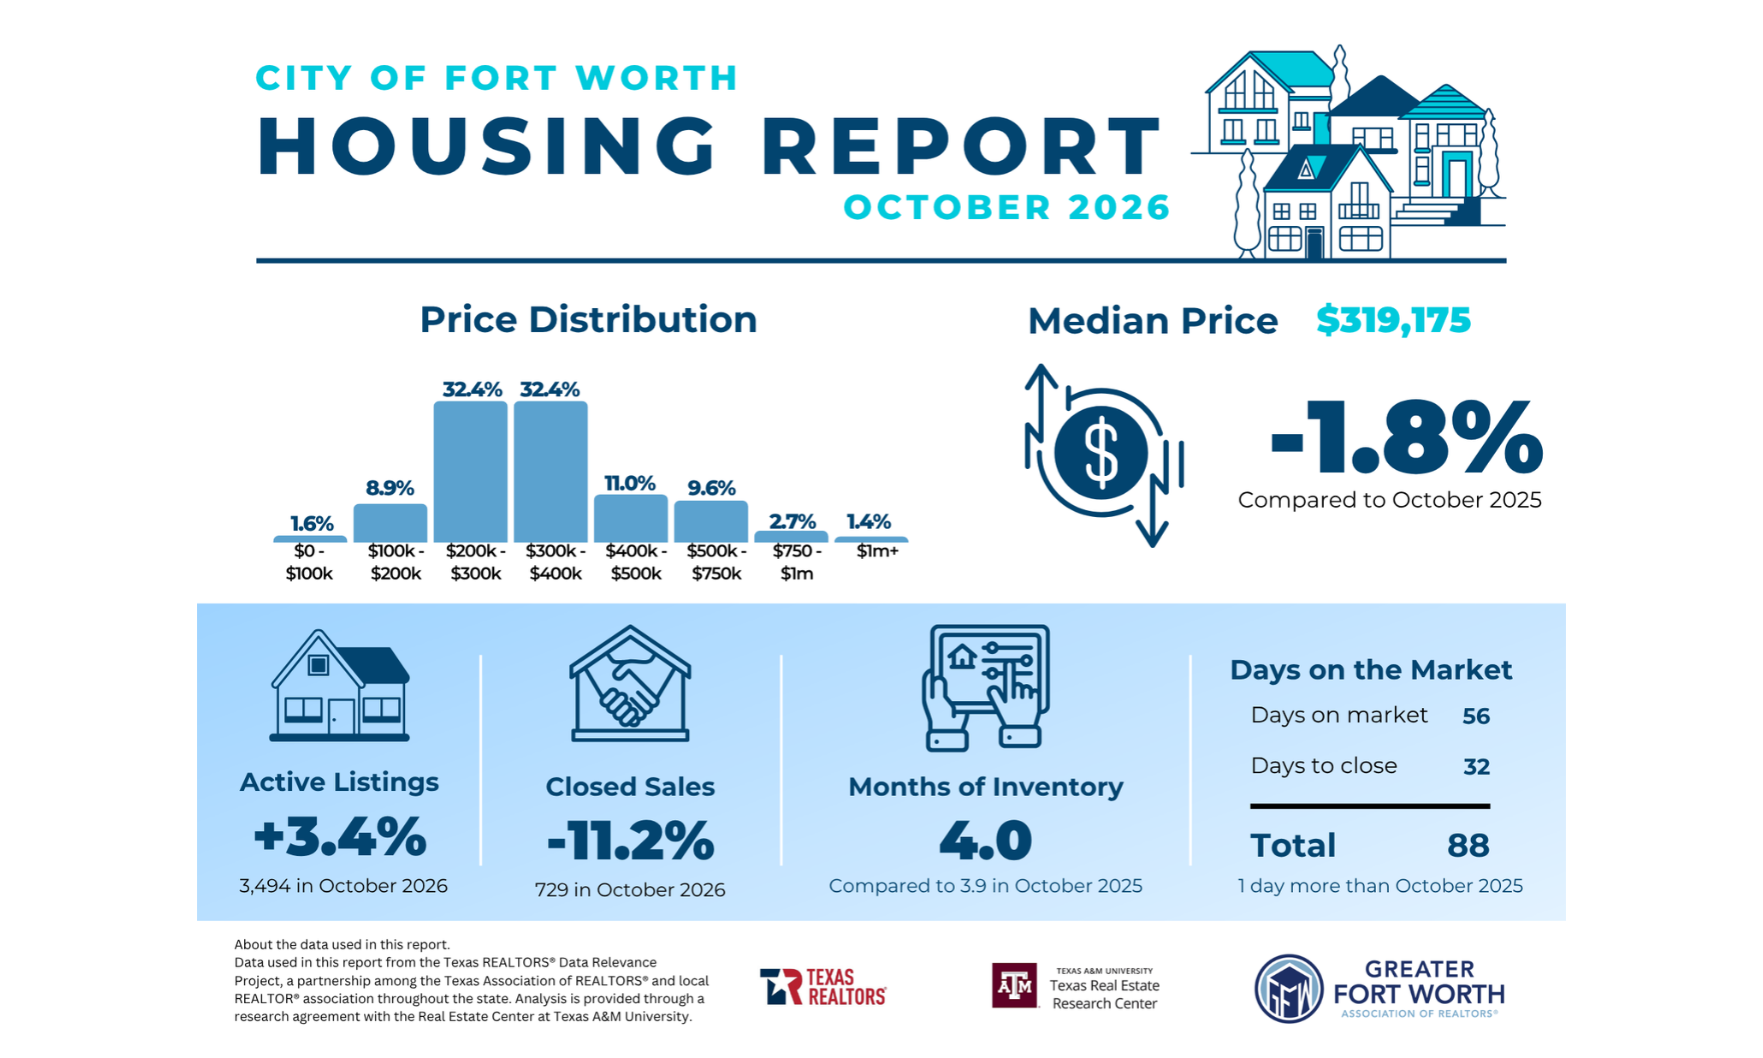
In the city of Fort Worth, active listings increased 3.4% year over year to 3,494 as closed home sales fell 11.2% to 729. Typical homes spent 88 days on market, just one day more than a year prior.
Given the rate of sales, Fort Worth had a four-month inventory, up from 3.9 months in October 2025.
Meanwhile, the city’s median price dipped 1.8% to $319,175. Equal proportions of homes (32.4%) fell into the $200,000 to $300,000 price range and the $300,000 to $400,000 price range.
The Fort Worth housing market by County
Tarrant County
In Tarrant County, active listings increased 0.5% to 6,857 as closings declined 14.5% to 1,533. Homes spent 89 days on market, up two days year over year. The county’s inventory increased to 3.8 months, up from 3.7 months in October 2025.
The county’s median home price slid 1.5% to $350,000. Most sold homes (29%) fell in the $300,000 to $400,000 price range, followed by the $200,000 to $300,000 range at 27.8%.
Denton County
Active listings rose 5.8% to 5,489 in Denton County last month as home sales dropped 15.7% to 939. Typical homes spent five more days on market than they did last October, up to 102 days.
Given the rate of sales, the county’s housing supply increased to 4.6 months, up from 4.3 months a year prior.
Meanwhile, the median home price declined 2.3% to $430,000, although most sales actually fell in the $300,000 to $400,000 range (28.3%) and the $500,000 to $750,000 range (25.3%).
Johnson County
A local outlier, Johnson County saw a 10.8% decrease in active listings amid an 8.1% increase in closed home sales in October.
Days on market fell 12 days year over year to 104. Amid that increased sales pace, the county’s inventory fell to 4.3 months, down from five months a year prior.
Johnson County prices took a significant hit: The median fell 8% to $315,000, although most homes (34.9%) fell in the $200,000 to $300,000 range.
Parker County
Parker County’s active inventory dipped 2.2% to 1,411 in October as closed home sales plummeted 20.8% to 190. Despite a slower pace of sales — 118 days on market, up five days year over year — the county’s inventory dipped to 5.3 months, down from 5.6 months last October.
Unlike the other counties in the Fort Worth area, Parker’s median home price increased 4.7% to $470,000 as the luxury segment outperformed more affordable segments. Most sales (26.1%) fell in the $500,000 to $750,000 range.