
Market activity was varied around the Fort Worth area across the third quarter of the year, according to the latest report from the Greater Fort Worth Association of REALTORS®.
“A common phrase in real estate is that real estate is local, and it is becoming ever more evident as pockets of the region continue to experience tight inventory and increased median home prices and other areas are more stable,” GFWAR President Shawn Buck said in a press release. “What we would like to see is more home inventory enter the market, which will allow better movement, including opening opportunities for first-time homebuyers.”
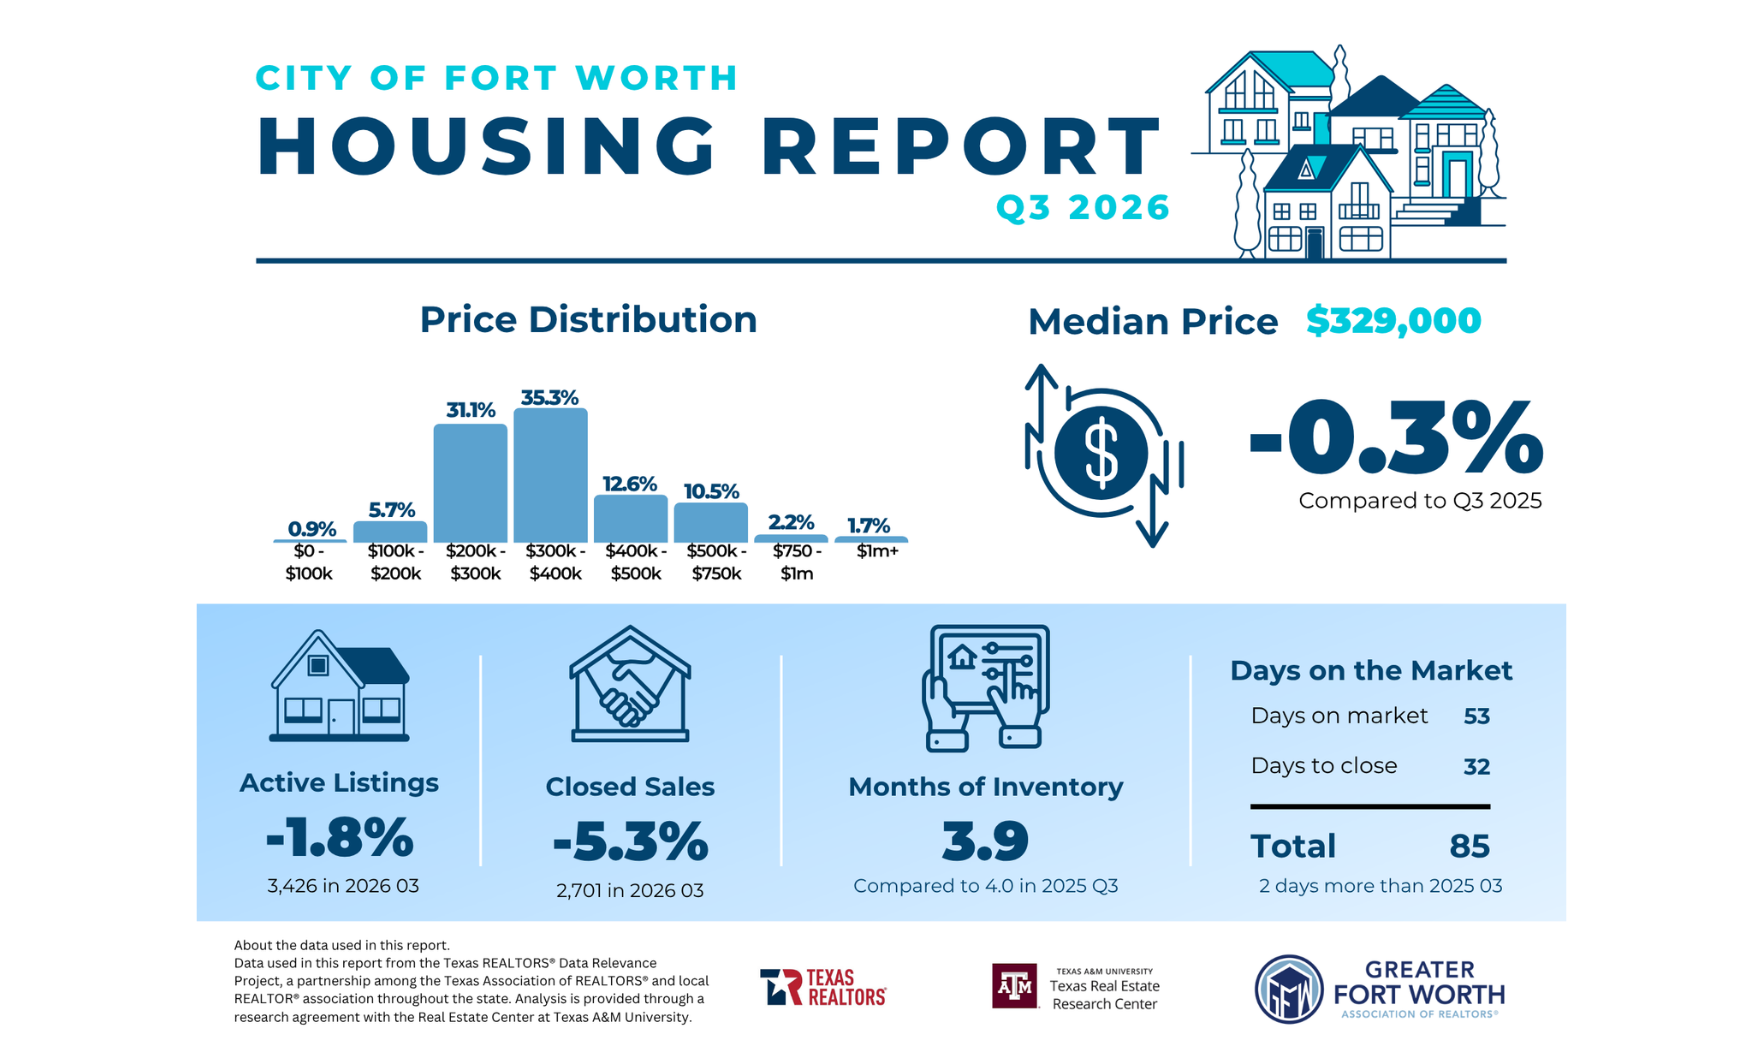
In the city of Fort Worth, specifically, closed home sales declined 5.3% year over year during the quarter, with 2,701 sales. Active listings declined 1.8% to 3,426, and the median price dipped 0.3% to $329,000.
The city had a 3.9-month inventory, down from four months a year prior.
The Fort Worth housing market by county
Tarrant County
In Tarrant County, closed home sales fell 5.1% year over year, with 5,692 sales in the third quarter. Active listings also declined 4.1% to 6,680.
The median home price decreased 1.4% year over year to $345,000, with nearly 32% of home sales falling in the $300,000 to $400,000 range, followed by 26.5% in the $200,000 to $300,000 range.
Typical homes sold in 81 days — 50 days on market, plus 31 days to close. Given the rate of sales, the county had a 3.6-month inventory, down from 3.8 months in the third quarter of 2025.
Parker County
Parker County saw a 1.7% annual increase in home sales in the third quarter, with 859 closings. Active listings declined 6.7% to 1,357.
Meanwhile, the median home price fell 3% to $465,750, although a majority of sales (28.3%) fell in the $500,000 to $750,000 price range.
The typical home sold in 102 days — 10 days fewer than a year prior. The county had a 5.1-month inventory during the quarter, down from 5.7 months in Q3 2025.
Denton County
In Denton County, closed home sales fell 1.5% to 3,776 in the third quarter. Active listings increased 3% to 5,468, though.
The median home price declined 1.9% year over year to $435,000. A majority of home sales (27.6%) fell in the $300,000 to $400,000 range, followed by 23.6% in the $500,000 to $750,000 range.
Typical homes sold in 92 days, spending two days longer on market than in the third quarter of 2025. The county’s inventory was steady year over year at 4.5 months.
Johnson County
Home sales increased 2.6% year over year in Johnson County, with 838 closings in the third quarter. Active listings declined 8.3% to 1,157.
Meanwhile, the median home price decreased 1.5% to $324,990, with 34.1% of sales falling below that in the $200,000 to $300,000 price range.
Homes took about one day longer to sell than a year prior, closing after 105 days on market. Given the rate of sales, the county had a 4.3-month inventory, down from 4.7 months in the third quarter of 2025.